Lecture 6.5: Evaluating Empirical Evidence
AREC 570 / ECON 530 · Unit 6
Before class
- Gibson, “Are You Estimating the Right Thing? An Editor Reflects” (Gibson 2019).
- Kim, “Tackling False Positives in Business Research: A Statistical Toolbox with Applications” (Kim 2019).
Readings and course handouts are available on Canvas.
Credibility involves more than identification
A strong design can still estimate a quantity different from the one the researcher intends.
Check:
- Research question.
- Estimand.
- Measurement.
- Population.
- Interpretation.
Source: Gibson (2019).
Does the measure match the concept?
- Does a registry describe residents or registered persons?
- Does expenditure reflect quantity, quality, or both?
- Does infrequent recall obscure variation within a period?
- Does aggregation hide the response of interest?
Institutional knowledge of the data matters.
Avoid discarding information unnecessarily
A continuous measure can be converted into an indicator, but that discards information.
Example: income versus an indicator for income below a poverty threshold.
Explain why the indicator matches the question. Consider how measurement error near the cutoff changes classification.
Spatial processes cross boundaries
A policy in one area may affect neighbors.
- Does the outcome depend on nearby exposure?
- Could the comparison group be affected?
- Does the estimated effect include spillovers?
- Does aggregation hide them?
Match the model and interpretation to the spatial process.
Discussion: Gibson
- Which example most clearly separates the intended and estimated quantity?
- Where does the problem enter: measurement, sample, design, or interpretation?
- Would a larger dataset solve it?
- Where would your project benefit most from additional effort?
Statistical significance answers a limited question
A p-value is the probability, under the null model, of a test statistic at least as extreme as the observed statistic.
It is not:
- The probability that the null is true.
- The probability that the result will replicate.
- The economic importance of the effect.
Type I error, Type II error, and power
| Decision | Null true | Specified alternative true |
|---|---|---|
| Reject null | Type I error | Correct rejection |
| Do not reject | Correct non-rejection | Type II error |
- : probability of Type I error.
- : probability of Type II error under a specified alternative.
- Power: .
Sample size changes power
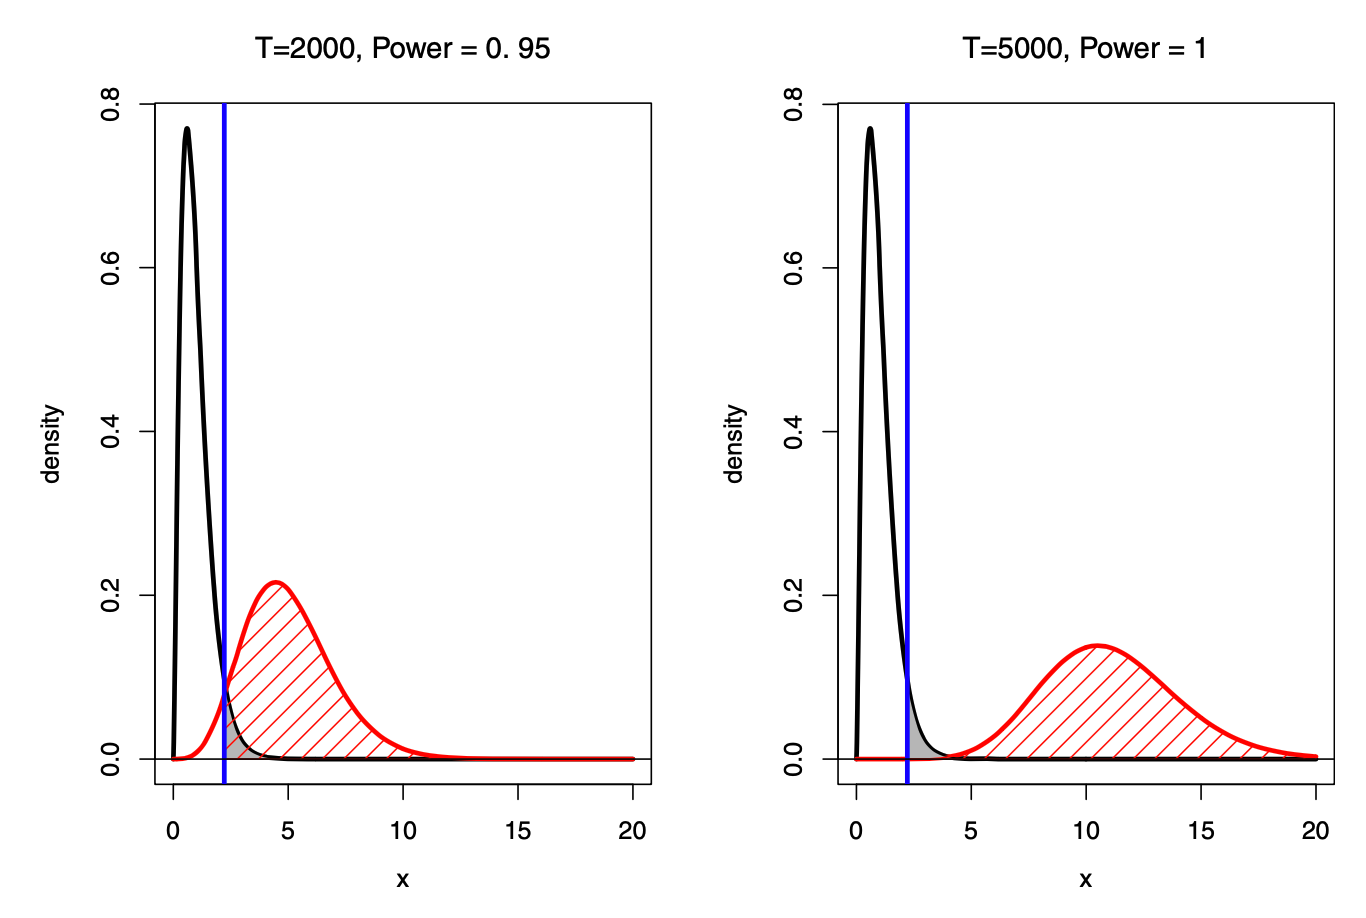
Source: Kim; retained from Unit 6, slide 71.
With a valid fixed-level test, increasing sample size does not inherently increase the nominal Type I error rate.
Statistical and economic importance
A very small effect may be precisely estimated.
Ask:
- What is the estimate in meaningful units?
- What range is compatible with the data and assumptions?
- What effect would matter for the decision?
- Could the result be a precise estimate of a biased quantity?
Discussion: Kim’s diagnosis
- Why does Kim object to relying on a single significance threshold?
- Which concerns involve sample size, measurement, or model misspecification?
- Which involve repeated testing or selective reporting?
- What would a useful statistical toolbox add?
Large samples do not erase bias
More observations can reduce variance while leaving systematic error.
Precision can make a biased estimate look convincing.
Bayesian evidence asks another question
A Bayes factor compares the marginal likelihood of the data under two models.
Posterior odds equal prior odds times the Bayes factor.
Neither a Bayes factor nor a posterior probability is the same as a p-value. State the hypotheses and prior assumptions.
Error costs and decision thresholds
An illustrative expected-loss criterion is
where is the prior probability of the null and are the costs of the two errors.
Choosing a threshold involves the decision context and the test’s operating characteristics.
Source: discussion in Kim (2019).
Equivalence is not failure to reject
A nonsignificant test against zero does not establish that the effect is negligible.
Equivalence testing instead specifies a substantively meaningful interval .
The question is whether evidence supports the effect lying inside that interval.
Choose using the economic question.
Exercise: interpret two findings
Hypothetical findings:
- Study A: estimated effect , interval .
- Study B: estimated effect , interval .
What can you say about precision, compatibility with zero, and economic importance?
What units and decision context are missing?
A transparent methods section
Report:
- Model and target parameter.
- Sample and variable construction.
- Source of identifying variation.
- Controls and their justification.
- Inference procedure.
- Planned sensitivity analyses.
Source: Unit 6, slides 85–89.
Discussion: use both readings
A paper reports a small p-value from a large administrative dataset.
Give one question from Gibson and one from Kim that you would ask before accepting the conclusion.
Explain why each question concerns a different part of the argument.
Workshop: an evidence audit
For your proposal:
- State the estimand in words.
- Check whether the measure matches it.
- Identify the largest source of systematic error.
- Define an economically meaningful effect.
- Explain how you will report uncertainty.
Before you leave
Name one conclusion that should not be drawn from a small p-value alone.
References
Course navigation
AREC 570 / ECON 530 · Methodology of Economic Research